Showing posts with label probability. Show all posts

Monday, November 28, 2022

Is this coin biased?

Tossing and turning

A few months ago, someone commented on one of my blog posts and asked how you work out if a coin is biased or not. I've been thinking about the problem since then. It's not a difficult one, but it does bring up some core notions in probability theory and statistics which are very relevant to understanding how A/B testing works, or indeed any kind of statistical test. I'm going to talk you through how you figure out if a coin is biased, including an explanation of some of the basic ideas of statistical tests.

The trial

A single coin toss is an example of something called a Bernoulli trial, which is any kind of binary decision you can express as a success or failure (e.g. heads or tails). For some reason, most probability texts refer to heads as a success. 

We can work out what the probability is of getting different numbers of heads from a number of tosses, or more formally, what's the probability \(P(k)\) of getting \(k\) heads from \(n\) tosses, where \(0 < k ≤ n\)? By hand, we can do it for a few tosses:

 Number of heads (k) Combinations (n)  Count  Probability 
 0 TTT 1 1/8
 1 HTT
 THT
 TTH
 3 3/8 
 2 THH
 HTH
 HHT
 3  3/8
 4 HHH 1 1/8

But what about 1,000 or 1,000,000 tosses - we can't do this many by hand, so what can we do? As you might expect, there's a formula you can use: 
\[P(k) = \frac{n!} {k!(n-k)!} p^k (1-p)^{n-k}\]
\(p\) is the probability of success in any trial, for example, getting a head. For an unbiased coin \(p=0.5\); for a coin that's biased 70% heads \(p=0.7\). 

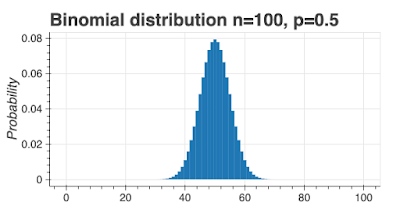
If we plot this function for an unbiased coin (\(p=0.5\)), where \(n=100\), and \(0 < k ≤ n\), we see this probability distribution:

This is called a binomial distribution and it looks a lot like the normal distribution for large (\(> 30\)) values of \(n\). 

I'm going to re-label the x-axis as a score equal to the fraction of heads: 0 means all tails, 0.5 means \(\frac{1}{2}\) heads, and 1 means all heads. With this slight change, we can more easily compare the shape of the distribution for different values of \(n\). 

I've created two charts below for an unbiased coin (\(p=0.5\)), one with \(n=20\) and one with \(n=40\). Obviously, the \(n=40\) chart is narrower, which is easier to see using the score as the x-axis. 

As an illustration of what these charts mean, I've colored all scores 0.7 and higher as red. You can see the red area is bigger for \(n=20\) than \(n=40\). Bear in mind, the red area represents the probability of a score of 0.7 or higher. In other words, if you toss a fair coin 20 times, you have a 0.058 chance of seeing a score of 0.7 or more, but if you toss a fair coin 40 times, the probability of seeing a 0.7 score drops to 0.008.


These charts tell us something useful: as we increase the number of tosses, the curve gets narrower, meaning the probability of getting results further away from \(0.5\) gets smaller. If we saw a score of 0.7 for 20 tosses, we might not be able to say the coin was biased, but if we got a score of 0.7 after 40 tosses, we know this score is very unlikely so the coin is more likely to be biased.

Thresholds

Let me re-state some facts:

  • For any coin (biased or unbiased) any score from 0 to 1 is possible for any number of tosses.
  • Some results are less likely than others; e.g. for an unbiased coin and 40 tosses, there's only a 0.008 chance of seeing a score of 0.7.

We can use probability thresholds to decide between biased and non-biased coins.  We're going to use a threshold (mostly called confidence) of 95% to decide if the coin is biased or not. In the chart below, the red areas represent 5% probability, and the blue areas 95% probability.

Here's the idea to work out if the coin is biased. Set a confidence value, usually at 0.05. Throw the coin \(n\) times, record the number of heads and work out a score. Draw the theoretical probability chart for the number of throws (like the one I've drawn above) and color in 95% of the probabilities blue and 5% red. If the experimental score lands in the red zones, we'll consider the coin to be biased, if it lands in the blue zone, we'll consider it unbiased.

This is probabilistic decision-making. Using a confidence of 0.05 means we'll wrongly say a coin is biased 5% of the time. Can we make the threshold higher, could we use 0.01 for instance? Yes, we could, but the cost is increasing the number of trials.

As you might expect, there are shortcuts and we don't actually have to draw out the chart. In Python, you can use the binom_test function in the stats package. 

To simplify, binom_test has three arguments:

  • x - the number of successes
  • n - the number of samples
  • p - the hypothesized probability of success
It returns a p-value which we can use to make a decision.

Let's see how this works with a confidence of 0.05. Let's take the case where we have 200 coin tosses and 140 (70%) of them come up heads. We're hypothesizing that the coin is fair, so \(p=0.5\).

from scipy import stats
print(stats.binom_test(x=140, n=200, p=0.5))

the p-value we get is 1.5070615573524992e-08 which is way less than our confidence threshold of 0.05 (we're in the red area of the chart above). We would then reject the idea the coin is fair.

What if we got 112 heads instead?

from scipy import stats
print(stats.binom_test(x=115, n=200, p=0.5))

This time, the p-value is 0.10363903843786755, which is greater than our confidence threshold of 0.05 (we're in the blue area of the chart), so the result is consistent with a fair coin (we fail to reject the null).

What if my results are not significant? How many tosses?

Let's imagine you have reason to believe the coin is biased. You throw it 200 times and you see 115 heads. binom_test tells you you can't conclude the coin is biased. So what do you do next?

The answer is simple, toss the coin more times.

The formulae for the sample size, \(n\), is:

\[n = \frac{p(1-p)} {\sigma^2}\]

where \(\sigma\) is the standard error. 

Here's how this works in practice. Let's assume we think our coin is just a little biased, to 0.55, and we want the standard error to be \(\pm 0.04\). Here's how many tosses we would need: 154. What if we want more certainty, say \(\pm 0.005\), then the number of tosses goes up to 9,900. In general, the bigger the bias, the fewer tosses we need, and the more certainty we want the more tosses we need. 

If I think my coin is biased, what's my best estimate of the bias?

Let's imagine I toss the coin 1,000 times and see 550 heads. binom_test tells me the result is significant and it's likely my coin is biased, but what's my estimate of the bias? This is simple, it's actually just the mean, so 0.55. Using the statistics of proportions, I can actually put a 95% confidence interval around my estimate of the bias of the coin. Through math I won't show here, using the data we have, I can estimate the coin is biased 0.55 ± 0.03.

Is my coin biased?

This is a nice theoretical discussion, but how might you go about deciding if a coin is biased? Here's a step-by-step process.

  1. Decide on the level of certainty you want in your results. 95% is a good measure.
  2. Decide the minimum level of bias you want to detect. If the coin should return heads 50% of the time, what level of bias can you live with? If it's biased to 60%, is this OK? What about biased to 55% or 50.5%?
  3. Calculate the number of tosses you need.
  4. Toss your coin.
  5. Use binom_test to figure out if the coin deviates significantly from 0.5.

Other posts like this

Friday, December 31, 2021

COVID and the base rate fallacy

COVID and the base rate fallacy

Should we be concerned that vaccinated people are getting COVID?

I’ve spoken to people who’re worried that the COVID vaccines aren’t effective because some vaccinated people catch COVID and are hospitalized. Let’s look at the claim and see if it stands up to analysis.

Let's start with some facts:

Marc Rummy’s diagram

Marc Rummy created this diagram to explain what’s going on with COVID hospitalizations. He’s made it free to share, which is fantastic.

In this diagram, the majority of the population is vaccinated (91%). The hospitalization rate for the unvaccinated is 50% but for the vaccinated, it’s 10%. If the total population is 110, this leads to 5 unvaccinated people hospitalized and 10 vaccinated people hospitalized - in other words, 2/3 of those in hospital with COVID have been vaccinated. 

Explaining the result

Let’s imagine we just looked at hospitalizations: 5 unvaccinated and 10 vaccinated. This makes it look like vaccinations aren’t working – after all, the majority of people in hospital are vaccinated. You can almost hear ignorant journalists writing their headlines now (“Questions were raised about vaccine effectiveness when the health minister revealed the majority of patients hospitalized had been vaccinated.”). But you can also see anti-vaxxers seizing on these numbers to try and make a point about not getting vaccinated.

The reason why the numbers are the way they are is because the great majority of people are vaccinated

Let’s look at three different scenarios with the same population of 110 people and the same hospitalization rates for vaccinated and unvaccinated:

  • 0% vaccinated – 55 people hospitalized
  • 91% vaccinated – 15 people hospitalized
  • 100% vaccinated – 11 people hospitalized

Clearly, vaccinations reduce the number of hospitalizations. The anti-vaccine argument seems to be, if it doesn't reduce the risk to zero, it doesn't work - which is a strikingly weak and ignorant argument.

In this example, vaccination doesn’t reduce the risk of infection to zero, it reduces it by a factor of 5. In the real world, vaccination reduces the risk of infection by 5x and the risk of death due to COVID by 13x (https://www.nytimes.com/interactive/2021/us/covid-cases.html). The majority of people hospitalized now appear to be unvaccinated even though vaccination rates are only just above 60% in most countries (https://www.nytimes.com/interactive/2021/world/covid-cases.html, https://www.masslive.com/coronavirus/2021/09/breakthrough-covid-cases-in-massachusetts-up-to-about-40-while-unvaccinated-people-dominate-hospitalizations.html).

The bottom line is very simple: if you want to reduce your risk of hospitalization and protect your family and community, get vaccinated.

The base rate fallacy

The mistake the anti-vaxxers and some journalists are making is a very common one, it’s called the base rate fallacy (https://thedecisionlab.com/biases/base-rate-fallacy/). There are lots of definitions online, so I’ll just attempt a summary here: “the base rate fallacy is where someone draws an incorrect conclusion because they didn’t take into account the base rate in the general population. It’s especially a problem for conditional probability problems.”

Let’s use another example from a previous blog post:

“Imagine there's a town of 10,000 people. 1% of the town's population has a disease. Fortunately, there's a very good test for the disease:

  • If you have the disease, the test will give a positive result 99% of the time (sensitivity).
  • If you don't have the disease, the test will give a negative result 99% of the time (specificity).

You go into the clinic one day and take the test. You get a positive result. What's the probability you have the disease?” 

The answer is 50%.

The reason why the answer is 50% and not 99% is because 99% of the town’s population does not have the disease (the base rate), which means half of the positives will be false positives.

What’s to be done?

Conditional probability (for example, the COVID hospitalization data) is screwy and can sometimes seem counter to common sense. The general level of statistical (and probability) knowledge in the population is poor. This leaves people trying to make sense of the data around them but without the tools to do it, so no wonder they’re confused.

It’s probably time that all schoolchildren are taught some basic statistics. This should include some counter-intuitive results (for example, the disease example above). Even if very few schoolchildren grow up to analyze data, it would be beneficial for society if more people understood that interpreting data can be hard and that sometimes surprising results occur – but that doesn’t make them suspicious or wrong.

More importantly, journalists need to do a much better job of telling the truth and explaining the data instead of chasing cheap clicks.

Monday, November 1, 2021

Why conditional probability screwiness matters for business

Things are not what they seem

Many business decisions come down to common sense or relatively simple math. But applying common sense to conditional probability problems can lead to very wrong results as we'll see. As data science becomes more and more important for business, decisions involving conditional probability will arise more often. In this blog post, I'm going to talk through some counter-intuitive conditional probability examples and where I can, I'll tell you how they arise in a business context.

(These two pieces of track are the same size. Ag2gaeh, CC BY-SA 4.0, via Wikimedia Commons.)

Testing for diseases

This is the problem with the clearest links to business. I'll explain the classical form of the problem and show you how it can come up in a business context.

Imagine there's some disease affecting a small fraction of the population, say 1%. A university develops a great test for the disease:

  • If you have the disease, the test will give you a positive result 99% of the time. 
  • If you don't have the disease, the test will give you a negative result 99% of the time.

You take the test and it comes back positive. What's the probability you have the disease? 

(COVID test kit. Centers for Disease Control and Prevention, Public domain, via Wikimedia Commons)

The answer is 50%.

If you want an explanation of the 50% number, read the section "The math", if you want to know how it comes up in business, skip to the section "How it comes up in business".

The math

What's driving the result is the low prevalence of the disease (1%). 99% of the people who take the test will be uninfected and it's this that pushes down the probability of having the disease if you test positive. 

There are at least two ways of analyzing this problem, one is using a tree diagram and one is using Bayes' Theorem. In a previous blog post, I went through the math in detail, so I'll just summarize the simpler explanation using a tree diagram. To make it easier to understand, I'll assume a population of 10,000.

Of the 10,000 people, 100 have the disease, and 9,900 do not. Of the 100, 99 will test positive for the disease. Of the 9,900, 99 will test positive for the disease. In total 99 + 99 will test positive, of which only 99 will have the disease. So 50% of those who test positive will have the disease.

How it comes up in business

Instead of disease tests, let's think of websites and algorithms. Imagine you're the CEO of a web-based business. 1% of the visitors to your website become customers. You want to identify who'll become a customer, so you task your data science team with developing an algorithm based on users' web behavior. You tell them the test is to distinguish customers from non-customers.

They come back with a complex test for customers that's 99% true for existing customers and 99% false for non-customers. Do you have a test that can predict who will become a customer and who won't?

This is the same problem as before, if the test is positive for a user, there's only a 50% chance they'll become a customer.

How many daughters?

This is a classic problem and shows the importance of describing a problem exactly. Exactly, in this case, means using very very precise English.

Here's the problem in its original form from Martin Gardner:

  1. Mr. Jones has two children. The older child is a girl. What is the probability that both children are girls?
  2. Mr. Smith has two children. At least one of them is a boy. What is the probability that both children are boys?
(What's the probability of two girls? Circle of Robert Peake the elder, Public domain, via Wikimedia Commons)

The solution to the first problem is simple. Assuming boys or girls are equally likely, then it's 50%.

The second problem isn't simple and has generated a great deal of debate, even 60 years after Martin Gardner published the puzzle. Depending on how you read the question, the answer is either 50% or 33%. Here's Khovanova's explanation:

"(i) Pick all the families with two children, one of which is a boy. If Mr. Smith is chosen randomly from this list, then the answer is 1/3.

(ii) Pick a random family with two children; suppose the father is Mr. Smith. Then if the family has two boys, Mr. Smith says, “At least one of them is a boy.” If he has two girls, he says, “At least one of them is a girl.” If he has a boy and a girl he flips a coin to say one or another of those two sentences. In this case, the probability that both children are the same sex is 1/2."

In fact, there are several other possible interpretations.

What does this mean for business? Some things that sound simple aren't and differences in the precise way a problem is formulated can give wildly different answers.

Airline seating

Here's the problem stated from an MIT handout:

"There are 100 passengers about to board a plane with 100 seats. Each passenger is assigned a distinct seat on the plane. The first passenger who boards has forgotten his seat number and sits in a randomly selected seat on the plane. Each passenger who boards after him either sits in his or her assigned seat if it is empty or sits in a randomly selected seat from the unoccupied seats. What is the probability that the last passenger to board the plane sits in her assigned seat?"

You can imagine a lot of seat confusion, so it seems natural to assume that the probability of the final passenger sitting in her assigned seat is tiny. 

(Ken Iwelumo (GFDL 1.2, GFDL 1.2 or GFDL 1.2), via Wikimedia Commons)

Actually, the probability of her sitting in her assigned seat is 50%.

StackOverflow has a long discussion on the solution to the problem that I won't repeat here.

What does this mean for business? It's yet another example of our intuition letting us down.

The Monty Hall problem 

This is the most famous of all conditional probability problems and I've written about it before. Here's the problem as posed by Vos Savant:

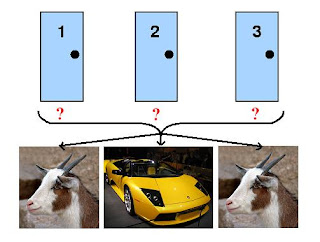
"A quiz show host shows a contestant three doors. Behind two of them is a goat and behind one of them is a car. The goal is to win the car.

The host asked the contestant to choose a door, but not open it.

Once the contestant has chosen a door, the host opens one of the other doors and shows the contestant a goat. The contestant now knows that there’s a goat behind that door, but he or she doesn’t know which of the other two doors the car’s behind.

Here’s the key question: the host asks the contestant "do you want to change doors?".

Once the contestant decided whether to switch or not, the host opens the contestant's chosen door and the contestant wins the car or a goat.

Should the contestant change doors when asked by the host? Why?"

Here are the results.

  • If the contestant sticks with their initial choice, they have a ⅓ chance of winning.
  • If the contestant changes doors, they have a ⅔ chance of winning.
I go through the math in these two previous blog posts "The Monty Hall Problem" and "Am I diseased? An introduction to Bayes theorem".

Once again, this shows how counter-intuitive probability questions can be.

What should your takeaway be, what can you do?

Probability is a complex area and common sense can lead you wildly astray. Even problems that sound simple can be very hard. Things are made worse by ambiguity; what seems a reasonable problem description in English might actually be open to several possible interpretations which give very different answers.

(Sound judgment is needed when dealing with probability. You need to think like a judge, but you don't have to dress like one. InfoGibraltar, CC BY 2.0, via Wikimedia Commons)

If you do have a background in probability theory, it doesn't hurt to remind yourself occasionally of its weirder aspects. Recreational puzzles like the daughters' problem are a good refresher.

If you don't have a background in probability theory, you need to realize you're liable to make errors of judgment with potentially serious business consequences. It's important to listen to technical advice. If you don't understand the advice, you have three choices: get other advisors, get someone who can translate, or hand the decision to someone who does understand. 

Monday, July 12, 2021

What is beta in statistical testing?

\(\beta\) is \(\alpha\) if there's an effect

In hypothesis testing, there are two kinds of errors:

  • Type I - we say there's an effect when there isn't. The threshold here is \(\alpha\).
  • Type II - we say there's no effect when there really is an effect. The threshold here is \(\beta\).

This blog post is all about explaining and calculating \(\beta\).


The null hypothesis

Let's say we do an A/B test to measure the effect of a change to a website. Our control branch is the A branch and the treatment branch is the B branch. We're going to measure the conversion rate \(C\) on both branches. Here are our null and alternative hypotheses:

  • \(H_0: C_B - C_A = 0\) there is no difference between the branches
  • \(H_1: C_B - C_A \neq 0\) there is a difference between the branches

Remember, we don't know if there really is an effect, we're using procedures to make our best guess about whether there is an effect or not, but we could be wrong. We can say there is an effect when there isn't (Type I error) or we can say there is no effect when there is (Type II error).

Mathematically, we're taking the mean of thousands of samples so the central limit theorem (CLT) applies and we expect the quantity \(C_B - C_A\) to be normally distributed. If there is no effect, then \(C_B - C_A = 0\), if there is an effect \(C_B - C_A \neq 0\).

\(\alpha\) in a picture

Let's assume there is no effect. We can plot out our expected probability distribution and define an acceptance region (blue, 95% of the distribution) and two rejection regions (red, 5% of the distribution). If our measured \(C_B - C_A\) result lands in the blue region, we will accept the null hypothesis and say there is no effect, If our result lands in the red region, we'll reject the null hypothesis and say there is an effect. The red region is defined by \(\alpha\).

One way of looking at the blue area is to think of it as a confidence interval around the mean \(x_0\):

\[\bar x_0 + z_\frac{\alpha}{2} s \; and \; \bar x_0 + z_{1-\frac{\alpha}{2}} s \]

In this equation, s is the standard error in our measurement. The probability of a measurement \(x\) lying in this range is:

\[0.95 = P \left [ \bar x_0 + z_\frac{\alpha}{2} s < x < \bar x_0 + z_{1-\frac{\alpha}{2}} s \right ] \]

If we transform our measurement \(x\) to the standard normal \(z\), and we're using a 95% acceptance region (boundaries given by \(z\) values of 1.96 and -1.96), then we have for the null hypothesis:

\[0.95 = P[-1.96 < z < 1.96]\]

\(\beta\) in a picture

Now let's assume there is an effect. How likely is it that we'll say there's no effect when there really is an effect? This is the threshold \(\beta\).

To draw this in pictures, I want to take a step back. We have two hypotheses:

  • \(H_0: C_B - C_A = 0\) there is no difference between the branches
  • \(H_1: C_B - C_A \neq 0\) there is a difference between the branches

We can draw a distribution for each of these hypotheses. Only one distribution will apply, but we don't know which one.


If the null hypothesis is true, the blue region is where our true negatives lie and the red region is where the false positives lie. The boundaries of the red/blue regions are set by \(\alpha\). The value of \(\alpha\) gives us the probability of a false positive.

If the alternate hypothesis is true, the true positives will be in the green region and the false negatives will be in the orange region. The boundary of the green/orange regions is set by \(\beta\). The value of \(\beta\) gives us the probability of a false negative.

Calculating \(\beta\)

Calculating \(\beta\) is calculating the orange area of the alternative hypothesis chart. The boundaries are set by \(\alpha\) from the null hypothesis. This is a bit twisty, so I'm going to say it again with more words to make it easier to understand.

\(\beta\) is about false negatives. A false negative occurs when there is an effect, but we say there isn't. When we say there isn't an effect, we're saying the null hypothesis is true. For us to say there isn't an effect, the measured result must lie in the blue region of the null hypothesis distribution.

To calculate \(\beta\), we need to know what fraction of the alternate hypothesis lies in the acceptance region of the null hypothesis distribution.

Let's take an example so I can show you the process step by step.

  1. Assuming the null hypothesis, set up the boundaries of the acceptance and rejection region. Assuming a 95% acceptance region and an estimated mean of x, this gives the acceptance region as:
    \[P \left [ \bar x_0 + z_\frac{\alpha}{2} s < x < \bar x_0 + z_{1-\frac{\alpha}{2}} s \right ] \] which is the mean and 95% confidence interval for the null hypothesis. Our measurement \(x\) must lie between these bounds.
  2. Now assume the alternate hypothesis is true. If the alternate hypothesis is true, then our mean is \(\bar x_1\).
  3. We're still using this equation from before, but this time, our distribution is the alternate hypothesis.
    \[P \left [ \bar x_0 + z_\frac{\alpha}{2} s < x < \bar x_0 + z_{1-\frac{\alpha}{2}} s \right ] ] \]
  4. Transforming to the standard normal distribution using the formula \(z = \frac{x - \bar x_1}{\sigma}\), we can write the probability \(\beta\) as:
    \[\beta = P \left [ \frac{\bar x_0 + z_\frac{\alpha}{2} s - \bar x_1}{s} < z < \frac{ \bar x_0 + z_{1-\frac{\alpha}{2}} s - \bar x_1}{s} \right ] \]

This time, let's put some numbers in. 

  • \(n = 200,000\) (100,000 per branch)
  • \(C_B = 0.062\)
  • \(C_A =  0.06\)
  • \(\bar x_0= 0\) - the null hypothesis
  • \(\bar x_1 = 0.002\) - the alternate hypothesis
  • \(s = 0.00107\)  - this comes from combining the standard errors of both branches, so \(s^2 = s_A^2 + s_B^2\), and I'm using the usual formula for the standard error of a proportion, for example, \(s_A = \sqrt{\frac{C_A(1-C_A)}{n} }\)

Plugging them all in, this gives:
\[\beta = P[ -3.829 < z < 0.090]\]
which gives \(\beta = 0.536\)

This is too hard

This process is complex and involves lots of steps. In my view, it's too complex. It feels to me that there must be an easier way of constructing tests. Bayesian statistics holds out the hope for a simpler approach, but widespread adoption of Bayesian statistics is probably a generation or two away. We're stuck with an overly complex process using very difficult language.

Reading more

Monday, May 17, 2021

Counting on Poisson

Why use the Poisson distribution?

Because it has properties that make it great to work with, data scientists use the Poisson distribution to model different kinds of counting data. But these properties can be seductive, and sometimes people model data using the Poisson distribution when they shouldn't. In this blog post, I'll explain why the Poisson distribution is so popular and why you should think twice before using it.

(Siméon-Denis Poisson by E. Marcellot, Public domain, via Wikimedia Commons)

Poisson processes

The Poisson distribution is a discrete event probability distribution used to model events created using a Poisson process. Drilling down a level, a Poisson process is a series of events that have these properties:

  • They occur at random but at a constant mean rate,
  • They are independent of one another, 
  • Two (or more) events can't occur at the same time

Good examples of Poisson processes are website visits, radioactive decay, and calls to a help center. 

The properties of a Poisson distribution

Mathematically, the Poisson probability mass function looks like this:

\[ P_r (X=k) = \frac{\lambda^k e^{- \lambda}}{k!} \]

where 

  • k is the number of events (always an integer)
  • \(\lambda\) is the mean value (or expected rate)

It's a discrete distribution, so it's only defined for integer values of \(k\).

Graphically, it looks like this for \(\lambda=6\). Note that it isn't symmetrical and it stops at 0, you can't have -1 events.

(Let's imagine we were modeling calls per hour in a call center. In this case, \(k\) is the measured calls per hour, \(P\) is their frequency of occurrence, and \(\lambda\) is the mean number of calls per hour).

Here are some of the Poisson distribution's properties:

  • Mean: \(\lambda\)
  • Variance: \(\lambda\)
  • Mode: floor(\(\lambda\))

The fact that some of the key properties are given by \(\lambda\) alone makes using it easy. If your data follows a Poisson distribution, once you know the mean value, you've got the variance (and standard deviation), and the mode too. In fact, you've pretty much got a full description of your data's distribution with just a single number.

When to use it and when not to use it

Because you can describe the entire distribution with just a single number, it's very tempting to assume that any data that involves counting follows a Poisson distribution because it makes analysis easier.  Sadly, not all counts follow a Poisson distribution. In the list below, which counts do you think might follow a Poisson distribution and which might not?

  • The number of goals in English Premier League soccer matches.
  • The number of earthquakes of at least a given size per year around the world.
  • Bus arrivals.
  • The number of web pages a person visits before they make a purchase.

Bus arrivals are not well modeled by a Poisson distribution because in practice they're not independent of one another and don't occur at a constant rate. Bus operators change bus frequencies throughout the day, with more buses scheduled at busy times; they may also hold buses at stops to even out arrival times. Interestingly, bus arrivals are one of the textbook examples of a Poisson process, which shows that you need to think before applying a model.

The number of web pages a person visits before they make a purchase is better modeled using a negative binomial distribution

Earthquakes are well-modeled by a Poisson distribution. Earthquakes in different parts of the world are independent of one another and geological forces are relatively constant, giving a constant mean rate for quakes. It's possible that two earthquakes could happen simultaneously in different parts of the world, which shows that even if one of the criteria might not apply, data can still be well-modeled by Poisson.

What about soccer matches? We know two goals can't happen at the same time. The length of matches is fixed and soccer is a low-scoring game, so the assumption of a constant rate for goals is probably OK. But what about independence? If you've watched enough soccer, you know that the energy level in a game steps up as soon as a goal is scored. Is this enough to violate the independence requirement? Apparently not, scores in soccer matches are well-modeled by a Poisson distribution.

What should a data scientist do?

Just because the data you're modeling is a count doesn't mean it follows a Poisson distribution. More generally, you should be wary of making choices motivated by convenience. If you have count data, look at the properties of your data before deciding on a distribution to model it with. 

If you liked this blog post you might like

Monday, January 4, 2021

COVID and soccer home team advantage - winning less often

Home advantage

Is it easier for a sports team to win at home? The evidence from sports as diverse as soccer [Pollard], American football [Vergina], rugby [Thomas], and ice hockey [Leard] strongly suggest there is a home advantage and it might be quite large. But what causes it? Is it the crowd cheering the home team, or closeness to home, or playing on familiar turf? One of the weirder side-effects of COVID is the insight it's proving into the origins of home advantage, as we'll see.

(Premier League teams playing in happier times. Image source: Wikimedia Commons, License: Creative Commons, Author: Brian Minkoff)

The EPL - lots of data makes analysis easier

The English Premier League is the world's wealthiest sports' league [Robinson].  There's worldwide interest in the league and there has been for a long time, so there's a lot of data available, which makes it ideal for investigating home advantage. One of the nice features of the league is that each team plays every other team twice, once at home and once away.

Expectation and metric

If there were no home team advantage, we would expect the number of home wins and away wins to be roughly equal for the whole league in a season. To investigate home advantage, the metric I'll use is:
\[home \ win \ proportion = \frac{number\ of\ home\ wins}{total\ number\ of\ wins}\]
If there were no home team advantage, we would expect this number to be close to 0.5.

EPL home team advantage

Let's look at the mean home-win proportion per season for the EPL. In the chart, the error bars are the 95% confidence interval.

For most seasons, the home win proportion is about 0.6 and it's significantly above 0.5 (in the statistical sense). In other words, there's a strong home-field advantage in the EPL.

But look at the point on the right. What's going on in 2020-2021?

COVID and home wins

Like everything else in the world, the EPL has been affected by COVID. Teams are playing behind closed doors for the 2020-2021 season. There are no fans singing and chanting in the terraces, there are no fans 'oohing' over near misses, and there are no fans cheering goals. Teams are still playing matches home and away but in empty and silent stadiums.

So how has this affected home team advantage?

Take a look at the chart above. The 2020-2021 season is the season on the right. Obviously, we're still partway through the season, which is why the error bars are so big, but look at the mean value. If there were no home team advantage, we would expect a mean of 0.5. For 2020-2021, the mean is currently 0.491. 

Let me put this simply. When there are fans in the stadiums, there's a home team advantage. When there are no fans in the stadiums, the home team advantage disappears.

COVID and goals

What about goals? It's possible that a team that might have lost is so encouraged by their fans that they reach a draw instead. Do teams playing at home score more goals?

I worked out the mean goal difference between the home team and the away team and I've plotted it for every season from 2000-2001 onwards.

If there were no home team advantage, you would expect the goal difference to be 0. But it isn't. It mostly hovers around 0.35. Except of course for 2020-2021. For 2020-2021, the goal difference is about zero. The home-field advantage has gone.

What this means

Despite the roll-out of the vaccine, it's almost certain the rest of the 2020-2021 season will be played behind closed doors (assuming the season isn't abandoned). My results are for a partial season, but it's a good bet the final results will be similar. If this is the case, then it will be very strong evidence that fans cheering their team really do make a difference.

If you want your team to win, you need to go to their games and cheer them on. 

References

[Leard] Leard B, Doyle JM. The Effect of Home Advantage, Momentum, and Fighting on Winning in the National Hockey League. Journal of Sports Economics. 2011;12(5):538-560.

[Pollard] Richard Pollard and Gregory Pollard, Home advantage in soccer: a review of its existence and causes, International Journal of Soccer and Science Journal Vol. 3 No 1 2005, pp28-44

[Robinson] Joshua Robinson, Jonathan Clegg, The Club: How the English Premier League Became the Wildest, Richest, Most Disruptive Force in Sports, Mariner Books, 2019

[Thomas] Thomas S, Reeves C, Bell A. Home Advantage in the Six Nations Rugby Union Tournament. Perceptual and Motor Skills. 2008;106(1):113-116

[Vergina] Roger C.Vergina, John J.Sosika, No place like home: an examination of the home field advantage in gambling strategies in NFL football, Journal of Economics and Business Volume 51, Issue 1, January–February 1999, Pages 21-31

Monday, December 7, 2020

How to (maybe) win at dice

Does God play dice with the universe?

Imagine I gave you an ordinary die, not special in any way, and I asked you to throw the die and record your results (how many 1s, how many 2s, etc.). What would you expect the results to be? Do you think you could win by choosing some numbers rather than others? Are you sure?

(Image source: Wikimedia Commons. Author: Diacritica. License: Creative Commons.)

What you might expect

Let's say you thew the die 12,000 times, you might expect a probability distribution something like this. This is a uniform distribution where all results are equally likely.

You know you'll never get an absolutely perfect distribution, so in reality, your results might look something like this for 12,000 throws. 

The deviations from the expected values are random noise that we can quantify. Further, we know that by adding more dice throws, random noise gets less and less and we approach the ideal uniform distribution more closely. 

I've simulated dice throws in the plots below, the top chart is 12,000 throws and the chart on the bottom is 120,000 throws. The blue bars represent the actual results, the black circle represents the expected value, and the black line is the 95% confidence interval. Note how the results for 120,000 throws are closer to the ideal than the results from 12,000 throws.


What happened in reality - not what you expect

My results are simulations, but what happens when you throw dice thousands of times in the real world?

There's a short history of probability theorists and statisticians throwing dice and recording the results.

  • Weldon threw 12 dice 26,306 times by hand and sent the results to his friend Francis Galton.
  • Iversen ran an experiment where 219 dice were rolled 20,000 times.

Weldon's data set is widely used to illustrate statistical concepts, especially after Pearson used it to explain his \(\chi^2\) technique in 1900. 

Despite the excitement you see at the craps tables in Las Vegas, throwing dice thousands of times is dull and is, therefore, an ideal job for a computer. In 2009, Zachariah Labby created apparatus for throwing dice and recording the scores using a camera and image processing. You can read more about his apparatus and experimental setup here. He 'threw' 12 dice 26,306 times and his machine recorded the results. 

In the chart below, the blue bars are his results, the black circle is the expected result, and the black line is the 95% confidence interval. I've taken the results from all 12 dice, so my throw count is \(12 \times 26,306\).

This doesn't look like a uniform distribution. To state the obvious, 1 and 6 occurred more frequently than theory would suggest - the deviation from the uniform distribution is statistically significant. The dice he used were not special dice, they were off-the-shelf standard unbiased dice. What's going on?

Unbiased dice are biased

Take a very close look at a normal die, the type pictured at the start of this post which is the kind of die you buy in shops.

By convention, opposite faces on dice sum to 7, so 1 is opposite 6, 3 is opposite to 4, and so on. Now look very closely again at the picture at the start of the post. Look at the dots on the face of the dice. Notice how they're indented. Each hole is the same size, but obviously, the number of holes on each face is different. Let's think of this in terms of weight. Imagine we could weigh each face of the dice. Let's pair up the faces, each side is paired with the face opposite it. Now let's weigh the faces and compare them.


The greatest imbalance in weights is the 1-6 combination. This imbalance is what's causing the bias.

Obviously, the bias is small, but if you roll the die enough times, even a small bias becomes obvious. 

Vegas here I come - or not...

So we know for dice bought in shops that 1 and 6 are ever so slightly more likely to occur than theory suggests. Now you know this, why aren't you booking your flight to Las Vegas? You could spend a week at the craps tables and make a little money.

Not so fast.

Let's look at the dice they use in Vegas.

(Image source: Wikimedia Commons. Author: Alper Atmaca License: Creative Commons.)

Notice that the dots are not indented. They're filled with colored material that's the same density as the rest of the dice. In other words, there's no imbalance, Vegas dice will give a uniform distribution, and 1 and 6 will occur as often as 2, 3, 4, or 5. You're going to have to keep punching the clock.

Some theory

Things are going to get mathematical from here on in. There won't be any new stories about dice or Vegas.

How did I get the expected count and error bars for each dice score? Let's say I threw the dice \(x\) times, it seems obvious we would get an expected count of \(\frac{x}{6}\) for each score, but why? What about the standard error?

Let's re-think the dice as a Bernoulli trial. Let's choose a score, say 1. If we throw the dice and it shows a 1, we consider that a success. If it shows anything else, we consider it a failure. Because we have a Bernoulli trial, we can use the binomial distribution to model the results.

Using Wikipedia's notation:

  • \(n\) is the number of throws
  • \(p\) is the probability of getting a 1, which is \(\frac{1}{6}\)
  • \(q = 1- p\) is the probability of getting 2-6, which is \(\frac{5}{6}\)

So, again using Wikipedia's handy summary, for \(n\) throws:

  • The mean is \(np = 12 \times 26,306 \times \frac{1}{6} = 52,612\)
  • The standard deviation is \(\sqrt{npq} = \sqrt{12 \times 26,306 \times \frac{1}{6} \times \frac{5}{6}} = 209.388\) 
  • The 95% confidence interval is \(52,202 \) to \(53,022\) (standard deviation by 1.96).

Publications

Academics live or die by publications and by citations of their publications. Labby's work has rightly been widely cited on the internet. I keep hoping that some academic will be inspired by Labby and use modern robotic technology and image recognition to do huge (million-plus) classical experiments, like tossing coins or selecting balls from an urn. It seems like an easy win to be widely cited!

Sunday, November 29, 2020

Am I diseased? An introduction to Bayes theorem

What is Bayes' theorem and why is it so important?

Bayes' theorem is one of the key ideas of modern data science; it's enabling more accurate forecasting, it's leading to shorter A/B tests, and it's fundamentally changing statistical practices. In the last twenty years, Bayes' theorem has gone from being a cute probability idea to becoming central to many disciplines. Despite its huge impact, it's a simple statement of probabilities: what is the probability of an event occurring given some other event has occurred? How can something almost trivial be so revolutionary? Why all this change now? In this blog post, I'm going to give you a brief introduction to Bayes' theorem and show you why it's so powerful. 

(Bayes theorem. Source: Wikimedia Commons. Author: Matt Buck. License: Creative Commons.)

A disease example without explicitly using Bayes' theorem

To get going, I want to give you a motivating example that shows you the need for Bayes' theorem. I'm using this problem to introduce the language we'll need. I'll be using basic probability theory to solve this problem and you can find all the theory you need in my previous blog post on probability. This example is adapted from Wayne W. LaMorte's page at BU; he has some great material on probability and it's well worth your time browsing his pages. 

Imagine there's a town of 10,000 people. 1% of the town's population has a disease. Fortunately, there's a very good test for the disease:

  • If you have the disease, the test will give a positive result 99% of the time (sensitivity).
  • If you don't have the disease, the test will give a negative result 99% of the time (specificity).

You go into the clinic one day and take the test. You get a positive result. What's the probability you have the disease? Before you go on, think about your answer and the why behind it.

Let's start with some notation.

  • D+ and D- represent having the disease and not having the disease
  • T+ and T- represent testing positive and testing negative
  • P(D+) represents the probability of having the disease (with similar meanings for P(D-), P(T+), P(T-))
  • P(T+ | D+) is the probability of testing positive given that you have the disease.

We can write out what we know so far:

  • P(D+) = 0.01
  • P(T+ | D+) = 0.99
  • P(T- | D-) = 0.99

We want to know P(D+ | T+). I'm going to build a decision tree to calculate what I need.

There are 10,000 people in the town, and 1% of them have the disease. We can draw this in a tree diagram like so.

For each of the branches, D+ and D-, we can draw branches that show the test results T+ and T-:


For example, we know 100 people have the disease, of whom 99% will test positive, which means 1% will test negative. Similarly, for those who do not have the disease, (9,900), 99% will test negative (9,801), and 1% will test positive (99).

Out of 198 people who tested positive for the disease (P(T+) = P(T+ | D+) + P(T+ | D-)), 99 people have it, so P(D+ | T+) = 99/198. In other words, if I test positive for the disease, I have a 50% chance of actually having it.

There are two takeaways from all of this:

  • Wow! Really, only a 50% probability! I thought it would be much higher! (This is called the base rate fallacy).
  • This is a really tedious process and probably doesn't scale. Can we do better? (Yes: Bayes' theorem.)

Who was Bayes?

Thomas Bayes (1702-1761), was an English non-conformist minister (meaning a protestant minister not part of the established Church of England). His religious duties left him time for mathematical exploration, which he did for his own pleasure and amusement; he never published in his lifetime in his own name. After his death, his friend and executor, Richard Price, went through his papers and found an interesting result, which we now call Bayes' theorem.  Price presented it at the Royal Society and the result was shared with the mathematical community. 


(Plaque commemorating Thomas Bayes. Source: Wikimedia Commons Author:Simon Harriyott License: Creative Commons.)

For those of you who live in London, or who visit London, you can visit the Thomas Bayes memorial in the historic Bunhill Cemetery where Bayes is buried. For the true probability pilgrim, it might also be worth visiting Richard Price's grave which is only a short distance away.

Bayes' theorem

The derivation of Bayes' theorem is almost trivial. From basic probability theory:

\[P(A  \cap B) = P(A) P(B | A)\]
\[P(A \cap B) =  P(B \cap A)\]

With some re-arranging we get the infamous theorem:

\[P(A | B) = \frac{P(B | A) P(A)}{P(B)}\]

Although this is the most compact version of the theorem, it's more usefully written as:

\[P(A | B) = \frac{P(B | A) P(A)}{P(B \cap A) + P(B \cap \bar A)} = \frac{P(B | A)P(A)}{P(B | A)P(A) + P(B | \bar A) P( \bar A)}\]

where \(\bar A\) means not A (remember \(1 = P(A) + P(\bar A)\)). You can get this second form of Bayes using the law of total probability and the multiplication rule (see my previous blog post).

So what does it all mean and why is there so much excitement over something so trivial?

What does Bayes' theorem mean?

The core idea of Bayesian statistics is that we update our prior beliefs as new data becomes available - we go from the prior to the posterior. This process is often iterative and is called the diachronic interpretation of Bayes theorem. It usually requires some computation; something that's reasonable to do given today's computing power and the free availability of numeric computing languages. This form of Bayes is often written:

\[P(H | D) = \frac{P(D | H) P(H)}{P(D)}\]

with these definitions:

  • P(H) - the probability of the hypothesis before the new data - often called the prior
  • P(H | D) - the probability of the hypothesis after the data - the posterior
  • P(D | H) - the probability of the data under the hypothesis, the likelihood
  • P(D) - the probability of the data, it's called the normalizing constant

A good example of the use of Bayes' theorem is its use to better quantify the health risk an individual faces from a disease. Let's say the risk of suffering a heart attack in any year is P(HA), however, this is for the population as a whole (the prior). If someone smokes, the probability becomes P(HA | S), which is the posterior, which may be considerably different from P(HA). 

Let's use some examples to figure out how Bayes works in practice.

The disease example using Bayes

Let's start from this version of Bayes:

\[P(A | B) = \frac{P(B | A)P(A)}{P(B | A)P(A) + P(B | \bar A) P( \bar A)}\]

and use the notation from our disease example:

\[P(D+ | T+) = \frac{P(T+ | D+)P(D+)}{P(T+ | D+)P(D+) + P(T+ | D-) P( D-)}\]

Here's what we know from our previous disease example:

  • P(D+) = 0.01 and by implication P(D-) = 0.99
  • P(T+ | D+) = 0.99 
  • P(T- | D-) = 0.99 and by implication P(T+ | D-) = 0.01

Plugging in the numbers:

\[P(D+ | T+) = \frac{0.99\times0.01}{0.99\times0.01 + 0.01\times0.99} = 0.5\]

The decision tree is easier for a human to understand, but if there are a large number of conditions, it becomes much harder to use. For a computer on the other hand, the Bayes solution is straightforward to code and it's expandable for a large number of conditions.

Predicting US presidential election results

I've blogged a lot about this, but not about using Bayesian methods. The basic concepts are fairly simple.

  • To predict a winner, you need to model the electoral college, which implies a state-by-state forecast.
  • For each state, you know who won last time, so you have a prior in the Bayesian sense.
  • In competitive states, there are a number of opinion polls that provide evidence of voter intention, this is the data or normalizing constant in Bayes-speak.

In practice, you start with a state-by-state prior based on previous elections or fundamentals, or something else. As opinion polls are published, you calculate a posterior probability for each of the parties to win the state election. Of course, you do this with Bayes theorem. As more polls come in, you update your model and the influence of your prior becomes less and less. In some versions of this type of modeling work, models take into account national polling trends too.

The landmark paper describing this type of modeling is by Linzer.

Using Bayes' theorem to prove the existence of God

Over history, there have been many attempts to prove the existence of God using scientific or mathematical methods. All of them have floundered for one reason or another. Interestingly, one of the first uses of Bayes' theorem was to try and prove the existence of God by proving miracles can happen. The argument was put forward by Richard Price himself. I'm going to repeat his analysis using modern notation, based on an explanation from Cornell University.

Price's argument is based on tides. We expect tides to happen every day, but if a tide doesn't happen, that would be a miracle. If T is the consistency of tides, and M is a miracle (no tide), then we can use Bayes theorem as:

\[P(M | T) = \frac{P(T | M) P(M)}{P(T | M) P(M) + P(T | \bar M) P(\bar M)}\]

Price assumed the probability of miracles existing was the same as the probability of miracles not existing (!), so \(P(M) = P(\bar M)\). If we plug this into the equation above and simplify, we get:

\[P(M | T) = \frac{P(T | M)}{P(T | M) + P(T | \bar M)}\]

He further assumed that if miracles exist, they would be very rare (or we would see them all the time), so:

\[P(T | \bar M) >> P(T | M)\]

he further assumed that \(P(T | M) = 1e^{-6}\) - in other words, if a miracle exists, it would happen 1 time in 1 million. He also assumed that if there were no miracles, tides would always happen, so \(P(T | \bar M) = 1\). The upshot of all this is that:

\[P(M | T) = 0.000001\]

or, there's a 1 in a million chance of a miracle happening.

There are more holes in this argument than in a teabag, but it is an interesting use of Bayes' theorem and does give you some indication of how it might be used to solve other problems.

Monty Hall and Bayes

The Monty Hall problem has tripped people up for decades (see my previous post on the problem). Using Bayes' theorem, we can rigorously solve it.

Here's the problem. You're on a game show hosted by Monty Hall and your goal is to win the car. He shows you three doors and asks you to choose one. Behind two of the doors are goats and behind one of the doors is a car. Once you've chosen your door, Monty opens one of the other doors to show you what's behind it. He always chooses a door with a goat behind it. Next, he asks you the key question: "do you want to change doors?". Should you change doors and why?

I'm going to use the diachronic interpretation of Bayes theorem to figure out what happens if we don't change:

\[P(H | D) = \frac{P(D | H) P(H)}{P(D)} = \frac{P(D | H) P(H)}{P(D | H)P(H) + P(D | \bar H) P( \bar D)}\]
  • \(P(H)\) is the probability our initial choice of door has a car behind it, which is \(\frac{1}{3}\).
  • \( P( \bar H) = 1- P(H) = \frac{2}{3} \)
  • \(P(D | H) = 1\) this is the probability Monty will show me a door with a goat given that I have chosen the door with a car - it's always 1 because Monty always shows me the door with a goat
  • \(P(D | \bar H) = 1\) this is the probability Monty will show me a door with a goat given that I have chosen the door with a goat - it's always 1 because Monty always shows me the door with a goat,

Plugging these numbers in:

\[P(H | D) = \frac{1 \times \frac{1}{3}}{1 \times \frac{1}{3} + 1 \times \frac{2}{3}} = \frac{1}{3}\]

If we don't change, then the probability of winning is the same as if Monty hadn't opened the other door. But there are only two doors, and \(P(\bar H) + P(H) = 1\). In turn, this means our winning probability if we switch is \(\frac{2}{3}\), so our best strategy is switching.

Searching for crashed planes and shipwrecks

On 1st June 2009, Air France Flight AF 447 crashed into the Atlantic. Although the flight had been tracked, the underwater search for the plane was complex. The initial search used Bayesian inference to try and locate where on the ocean floor the plane might be. It used data from previous crashes that assumed the underwater locator beacon was working. Sadly, the initial search didn't find the plane.

In 2011, a new team re-examined the data, with two crucial differences. Firstly, they had data from the first search, and secondly, they assumed the underwater locator beacon had failed. Again using Bayesian inference, they pointed to an area of ocean that had already been searched. The ocean was searched again (with the assumption the underwater beacon had failed), and this time the plane was found.

You can read more about this story in the MIT Technology Review and for more in-depth details, you can read the paper by the team that did the analysis.

It turns out, there's quite a long history of analysts using Bayes theorem to locate missing ships. In this 1971 paper, Richardson and Stone show how it was used to locate the wreckage of the USS Scorpion. Since then, a number of high-profile wrecks have been located using similar methods.

Sadly, even Bayes' theorem hasn't led to anyone finding flight MH370. 

Other examples of Bayes' theorem

Bayes has been applied in many, many disciplines. I'm not going to give you an exhaustive list, but I will give you some of the more 'fun' ones.

Why now?

Using Bayes theorem can involve a lot of fairly tedious arithmetic. If the problem requires many iterations, there are lots of tedious calculations. This held up the adoption of Bayesian methods until three things happened:

  • Cheap computing.
  • The free and easy availability of mathematical computing languages.
  • Widespread skill to program in these languages.

By the late 1980s, computing power was sufficiently cheap to make Bayesian methods viable, and of course, computing has only gotten cheaper since then. Good quality mathematical languages were available by the late 1980s too (e.g. Fortran, MATLAB), but by the 2010s, Python and R had all the necessary functionality and were freely and easily available. Both Python and R usage had been growing for a while, but by the 2010s, there was a very large pool of people who were fluent in them.

As they say in murder mysteries, by the 2010s, Bayesian methods had the means, the motive, and the opportunity.

Bayes and the remaking of statistics

Traditional (non-Bayesian) statistics are usually called frequentist statistics. It has a long history and has been very successful, but it has problems. In the last 50 years, Bayesian analysis has become more successful and is now challenging frequentist statistics. 

I'm not going to provide an in-depth critique of frequentist statistics here, but I will give you a high-level summary of some of the problems.

  • p-values and significance levels are prone to misunderstandings - and the choice of significance levels is arbitrary
  • Much of the language surrounding statistical tests is complex and rests on convention rather than underlying theory
  • The null hypothesis test is frequently misunderstood and misinterpreted
  • Prior information is mostly ignored.

Bayesian methods help put statistics on a firmer intellectual foundation, but the price is changing well-understood and working frequentist statistics. In my opinion, over the next twenty years, we'll see Bayesian methods filter down to undergraduate level and gradually replace the frequentist approach. But for right now, the frequentists rule.

Conclusion

At its heart, Bayes' theorem is almost trivial, but it's come to represent a philosophy and approach to statistical analysis that modern computing has enabled; it's about updating your beliefs with new information. A welcome side-effect is that it's changing statistical practice and putting it on a firmer theoretical foundation. Widespread change to Bayesian methods will take time, however, especially because frequentist statistics are so successful.

Reading more