Correlation is not causation
Because they’ve misunderstood one of the main rules of statistical evidence, I’ve seen people make serious business mistakes and damage their careers. The rule is a simple, but subtle one: correlation is not causation. I’m going to explain what this means and show you cases where it’s obviously true, and some cases where it’s less obvious. Let’s start with some definitions.

Clearly, causation means one thing causes another. For example, prolonged exposure to ultraviolet light causes sunburn, the Vibrio cholerae bacteria causes cholera, and recessions cause bankruptcies.
What is correlation?
Correlation occurs when two things vary in the same way. For example, lung cancer rates vary with the level of smoking, commuting times vary with the state of the economy, and health and longevity are correlated with income and wealth. The relationship usually becomes clear when we plot the data out, but it’s very rarely perfect. To give you a sense of what I mean, I’ve taken the relationship between brain mass and body mass in mammals and plotted the data below, each dot is a different type of mammal [Rogel-Salazar].

The straight line on the chart is a fit to the data. As you can see, there’s a relationship between brain and body mass but the dots are spread.
We measure how well two things are correlated with something called the correlation coefficient, r. The closer r is to 1 (or -1), the better the correlation (this is a gross simplification). I typically look for r to be 0.8 (or < -0.8) or better. For the brain and body data above, r is 0.89, so the correlation is ‘good’.
For causation to exist, to say that A causes B, we must be able to observe the correlation between A and B. If sunscreen is effective at reducing sunburn we should observe increased sunscreen use leading to reduced sunburn. However, we need more than correlation to prove causation (I’m skipping over details to keep it simple).
Correlations does not imply causation
Here’s the important bit: correlation does not imply causation. Just because two things are correlated does not imply that one causes the other. Two things could be very well correlated and there could be no causal relationship between them at all. There could be a confounding factor that causes both variables to move in the same way. In my view, misunderstanding this is the single biggest problem in data analysis.
The excellent website Spurious Correlations shows the problem in a fun way, I’ve adapted an example from the website to illustrate my point. Here are two variables I've shown varying with time.
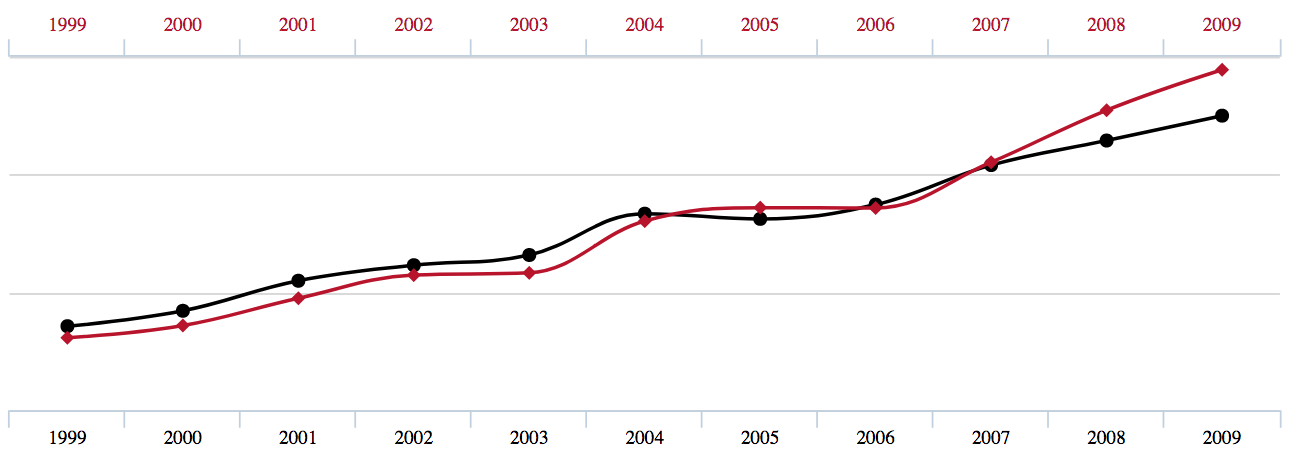
Imagine one of the variables was sales revenue and the other was the number of hours of sales effort. The correlation between them is very high (r=0.998). Would you say the amount of sales effort causes the sales revenue? If sales revenue was important to you, would you invest in more sales hours? If I presented this evidence to you in an executive meeting, what would you say?
Actually, I lied to you. The red line is US spending on science, space, and technology and the black line is suicides by hanging, strangulation, and suffocation. How can these things be related to each other? Because there’s some other variable or variables both of them depend on, or frankly, just by chance. Think for a minute what happens as an economy grows, all kinds of expenditure goes up; sales of expensive wine go up, and people spend more on their houses. Does that mean sales of expensive wine cause people to spend more on houses?
(On the spurious correlations website there are a whole bunch of other examples, including: divorce rates in Maine correlated with per capita consumption of margarine, total revenue generated by arcades is correlated with the age of Miss America, and letters in the winning word of the Scripps National Spelling Bee are correlated with number of people killed by venomous spiders.)
The chart below shows the relationship between stork pairs and human births for several European locations 1980-1990 [Matthews]. Note r is high at 0.85.

Is this evidence that storks deliver babies? No. Remember correlation is not causation. There could well be many confounding variables here, for example, economic growth leading to more leisure time. Just because we don’t know what the confounding factors are doesn’t mean they don’t exist.
My other (possibly apocryphal) example concerns lice. In Europe in the middle ages, lice were considered beneficial (especially for children) because sick people didn’t have as many lice [Zinsser]. Technically, this type of causation mistake is known as the post hoc ergo propter hoc fallacy if you want to look it up.
Correlation/causation offenders
The causation/correlation problem often rears its ugly head in sales and marketing. Here are two examples I’ve seen, with the details disguised to protect the guilty.
I’ve seen a business analyst present the results of detailed sales data modeling and make recommendations for change based on the correlation/causation confusion. The sales data set was huge and they’d found a large number of correlations in the data (with good r values). They concluded that these correlations were causation, for example, in area X sales scaled with the number of sales reps and they concluded that more reps = more sales. They made a series of recommendations based on their findings. Unfortunately, most of the relationships they found were spurious and most of their recommendations and forecasts were later found to be wrong. The problem was, there were other factors at play that they hadn’t accounted for. It doesn’t matter how complicated the model or how many hours someone has put in, the same rule applies; correlation does not imply causation.
The biggest career blunder I saw was a marketing person claiming that visits to the company website were driving all company revenue, I remember them talking about the correlation and making the causation claim to get more resources for their group. Unfortunately, later on, revenue went down for reasons (genuinely) unrelated to the website. The website wasn’t driving all revenue - it was just one of a number of factors, including the economy and the product. However, their claim to be driving all revenue wasn’t forgotten by the executive team and the marketing person paid the career price.
Here’s what I think you should take away from all this. Just because two things appear to be correlated doesn’t mean there’s causation. In business, we have to make decisions on the basis of limited evidence and that’s OK. What’s not OK is to believe there’s evidence when there isn’t - specifically to infer causation from correlation. Statistics and experience teach us humility. The UK Highway Code has some good advice here, a green light doesn’t mean go, it means ‘proceed with caution'.
References
[Matthews] ‘Storks Deliver Babies (p=0.008)’, Robert Matthews, Teaching Statistics. Volume 22, Number 2, Summer 2000
[Rogel-Salazar] Rogel-Salazar, Jesus (2015): Mammals Dataset. figshare. Dataset. https://doi.org/10.6084/m9.figshare.1565651.v1
[Zinsser] ‘Rats, lice, and history’, Hans Zinsser, Transaction Publishers, London, 2008


